Assumptions
To model congestion, we first make some basic assumptions. Let’s consider a neighborhood with 50 households that are connected to an electricity cabin. This cabin has a maximum capacity of power that can flow through it. We assume this to be 25kWh.
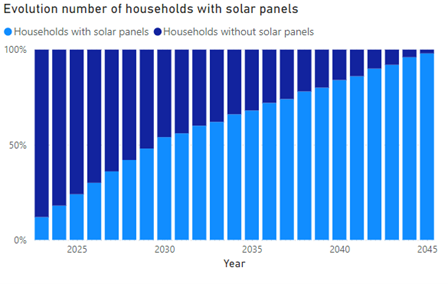
As of 2023, we assume 6 households (12%) have solar panels. Over the years, we let this amount grow, up to 49 households in 2045 (98%).
 We utilize open data made available by Fluvius, containing electricity usage rates for 100 EAN connections in 2021. Of these 100 connections, half have solar panels, and the other half do not. This means that households with solar panels will have negative demand when they inject electricity into the grid. The data contains usage values for one year, and demand is measured every 15 minutes (kWh).
Demand curve and congestion over time
From our data, we can derive the two average demand profiles: households with and without solar panels. As such, we can calculate the average demand per profile per quarter-hour. Based on the number of households with and without solar panels in a certain year, we can now find the aggregated demand for every quarter hour.
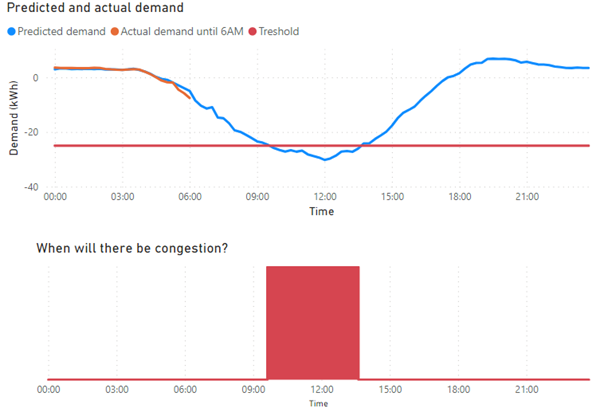
Congestion arises when this aggregated demand deviates above or below the cabin’s threshold, usually due to excessive injection. An example is visualized in the graph above. The demand curve dives below the cabin’s threshold around 9 a.m., and stays below it until about 2 p.m.
 From this graph, we can define the congestion percentage for a day as the number of quarters with congestion relative to the total day (96 quarters). In this example, the congestion percentage is about 20%.
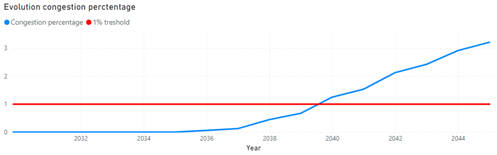
We can also look at the congestion percentage over a whole year. This percentage will increase as the number of households with solar panels increases. From a customer satisfaction standpoint, we can also set a threshold for the tolerated congestion percentage.
In our model, we chose 1%, which means solar panels can be turned off for a maximum of 87 hours per year. This might seem low, but since congestion usually happens in the summer months and around noon, 1% is quite significant. According to our model, the congestion percentage stays low until 2036 and starts increasing afterwards. The threshold will be exceeded between 2039 and 2040 if no mitigation strategies are implemented.
Modeling yearly congestion trends
We can also look at the congestion percentage over a whole year. This percentage will increase as the number of households with solar panels increases. From a customer satisfaction standpoint, we can also set a threshold for the tolerated congestion percentage.
In our model, we chose 1%, which means solar panels can be turned off for a maximum of 87 hours per year. This might seem low, but since congestion usually happens in the summer months and around noon, 1% is quite significant. According to our model, the congestion percentage stays low until 2036 and starts increasing afterwards. The threshold will be exceeded between 2039 and 2040 if no mitigation strategies are implemented.
 It should be noted that, under our assumptions, certain neighborhoods will cross this threshold a lot sooner than 2039, since the number of households with solar panels in a neighborhood might vary a lot geographically. As described in our previous article, the first areas in Belgium are already being affected by this negative trend.
Possible refinements
In this article, we focused on the long-term trend of congestion levels. However, from the system operator's perspective, the short-term prediction is interesting as well. Such a short-term model could incorporate weather data as well as historical data. Below is an example of how such a predictive model could be visualized. It shows how congestion evolves starting at 6 a.m.
 In our model, we worked with two demand profiles. A possible refinement would be to consider more demand profiles, for example, households that charge electric vehicles or companies.
Future-proofing grids
Congestion management in electricity networks is a growing challenge that requires accurate prediction and proactive measures to prevent customer dissatisfaction. With the ongoing growth of solar energy in households, we believe that it’s crucial to take these issues seriously and work towards sustainable solutions for the future of our electricity networks.


